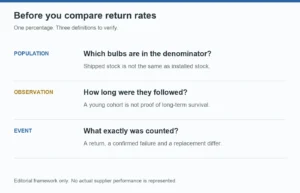
Featured image: Original editorial diagram. No actual HongYu or competitor return-rate data are shown.
Supplier A reports a return rate of 0.64%. Supplier B reports 1.40%. The purchasing team moves more orders to A.
That decision looks reasonable until someone separates residential orders from hospitality projects. In the worked example below, B has a lower observed return proportion in both applications. Its overall number looks worse because its sales are concentrated in the application with more returns.
No arithmetic is wrong. The comparison is wrong.
For LED bulb importers and private-label brands, return data can be valuable early-warning evidence. But a percentage becomes useful only after you know which units were counted, how long they were observed, what happened to them and which applications they served.
First, Name the Number You Are Comparing
"Return rate" often hides several different metrics. A warehouse counts packages received. A finance team counts credits. A technical team counts confirmed product failures. These figures should reconcile, but they need not be equal.
| Metric | Useful definition | What it cannot establish alone |
|---|---|---|
| Shipment-cohort return proportion | Unique returned units from a defined shipment group divided by units in that group, as of a stated date | Reliability after a specified period in service |
| Installed-cohort return proportion | Unique units returned by an agreed age in service divided by the corresponding installed cohort, with adequate follow-up | Whether every return was a product failure |
| Confirmed-failure proportion | Unique units meeting a defined failure criterion within a matched population and observation window | Performance in unobserved applications or later life |
| Replacement quantity | Units supplied to resolve claims | Number of distinct original bulbs that failed |
In reliability engineering, failure or hazard rate has a more specific meaning: a time-dependent rate for units that have survived to that age, expressed per unit of time. It is not simply a dimensionless returns percentage.[1]
Consider a separate hypothetical shipment of 10,000 bulbs. Only 2,000 have entered service, and 100 of those installed units have been returned by the reporting date. The shipment-cohort return proportion is 1%; the observed returned share of the installed group is 5%. Neither establishes a lifetime failure probability, and the second figure still needs a time window and reason classification.
Uninstalled stock is not evidence that a bulb has survived operation. Equally, a supplier should not divide all shipment returns by a small known installed subset unless those returned units actually belong to that subset.
Buyer judgment 1: Require the numerator, denominator, cohort and cutoff date beside every percentage. A bare number is not a supplier comparison.
The Application Mix Can Reverse the Ranking
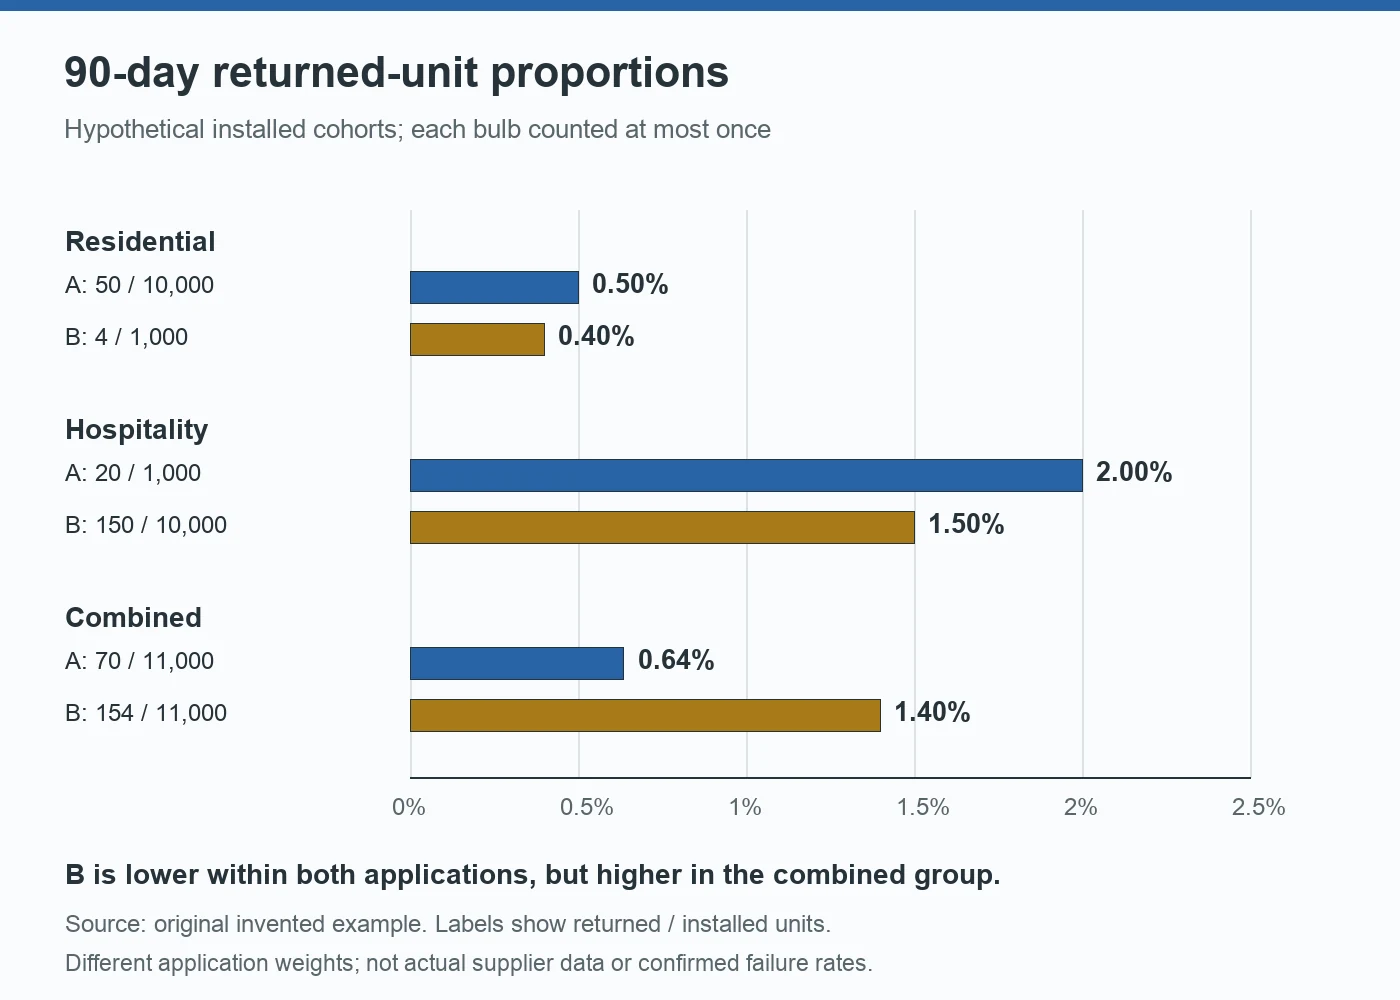
The following is an invented dataset, not HongYu or competitor performance. Assume comparable product requirements within each application, identical return definitions and reporting coverage, and tracking of each installed bulb until its first return or 90 days in service. There is no missing follow-up in this simplified example.
| Application | Supplier A: returned / installed | A: 90-day proportion | Supplier B: returned / installed | B: 90-day proportion |
|---|---|---|---|---|
| Residential | 50 / 10,000 | 0.50% | 4 / 1,000 | 0.40% |
| Hospitality | 20 / 1,000 | 2.00% | 150 / 10,000 | 1.50% |
| Combined | 70 / 11,000 | 0.64% | 154 / 11,000 | 1.40% |
B has the lower observed proportion in each application. Yet its combined proportion is higher because most of B's bulbs are in the higher-return group. A's volume is concentrated in the lower-return group.
If a buyer applies an illustrative common mix of 50% residential and 50% hospitality, the weighted proportions become 1.25% for A and 0.95% for B. That calculation removes this particular mix difference. It is not a forecast or proof that B's underlying reliability is superior: sampling uncertainty, reporting behavior and other differences still matter.
The operational lesson is simpler than the statistics. Compare like applications first, then use a documented weighting if an overall purchasing score is needed. Do not average the two percentages without deciding what population that average is meant to represent.
For the EU standard filament bulb range, a useful record goes beyond the series name: retain exact model, voltage, revision, production batch and installation context. Combining every standard lamp into one supplier-wide number can conceal a problem confined to a particular configuration.
Buyer judgment 2: Compare matched applications before ranking suppliers. A pooled percentage can reward an easier sales mix rather than a better product.
A Younger Shipment Has Had Less Opportunity to Fail
Two batches sold in the same calendar month may reach customers at different times. One stays in distribution stock; the other enters a hotel renovation immediately. Comparing returns at month-end does not give them equal exposure.
Keep shipment date, installation date, failure or symptom date, and claim date separate. The date a customer opens a claim is not necessarily the date the bulb stopped working. When the timing is only known approximately, record an interval instead of inventing an exact hour.
NIST distinguishes exact failure times, observed survival times and interval observations. Units still functioning when observation ends provide right-censored information: they survived to that point, but their eventual failure time is unknown.[2]
In field records, "no complaint received" is not automatically the same as "verified still operating." Some customers do not report failures; some installations cannot be followed. Mark unknown status explicitly rather than treating every silent account as a successful observation.
For a simple 90-day comparison, do not label a bulb observed for only 20 days a 90-day survivor. Report cohort maturity and coverage. Where reliable unit-level timing exists, a qualified analyst can use an appropriate survival method; NIST describes Kaplan-Meier estimation for complete and censored observations.[3] Such methods do not repair biased reporting or missing installation dates automatically, and ordinary use requires appropriate assumptions about censoring.
Calendar age is not the whole exposure story either. A lamp operated two hours each evening and one operated for long hospitality shifts can have the same installation age but very different accumulated hours. Record hours or duty estimates with their source and uncertainty; do not present estimated hours as meter readings.
Buyer judgment 3: Compare equal ages in service and disclose follow-up coverage. When exposure is unknown, narrow the claim instead of filling the gap with zero failures.
A Return Is a Symptom, Not a Root Cause
LED reliability is not limited to lamps going completely dark. DOE identifies other relevant outcomes, including unacceptable color shift, alongside loss of light output and catastrophic failure.[4] A useful field record therefore needs both the reported symptom and the investigation outcome.
| Initial report | Keep in the record | Avoid concluding prematurely |
|---|---|---|
| Does not start | Supply and control configuration, identifiers, safe technical test outcome | Every no-start claim proves a manufacturing defect |
| Flickers or behaves differently when dimmed | Controller model, lamp count, settings and conditions where the issue occurs | A brief full-output bench check disproves the complaint |
| Color or brightness complaint | Agreed requirement, comparison conditions and suitable measurements | The lamp is acceptable merely because it still lights |
| Broken glass or physical damage | Receiving condition, packaging evidence and handling history | The damage occurred during operation |
| No issue reproduced | Exact test scope and unresolved conditions | The customer was wrong or the unit is proven fault-free |
For dim-to-warm LED bulbs, for example, a report about the low-level transition should retain the controller and operating state. A successful test on an unrelated supply may answer a different question from the customer's complaint.
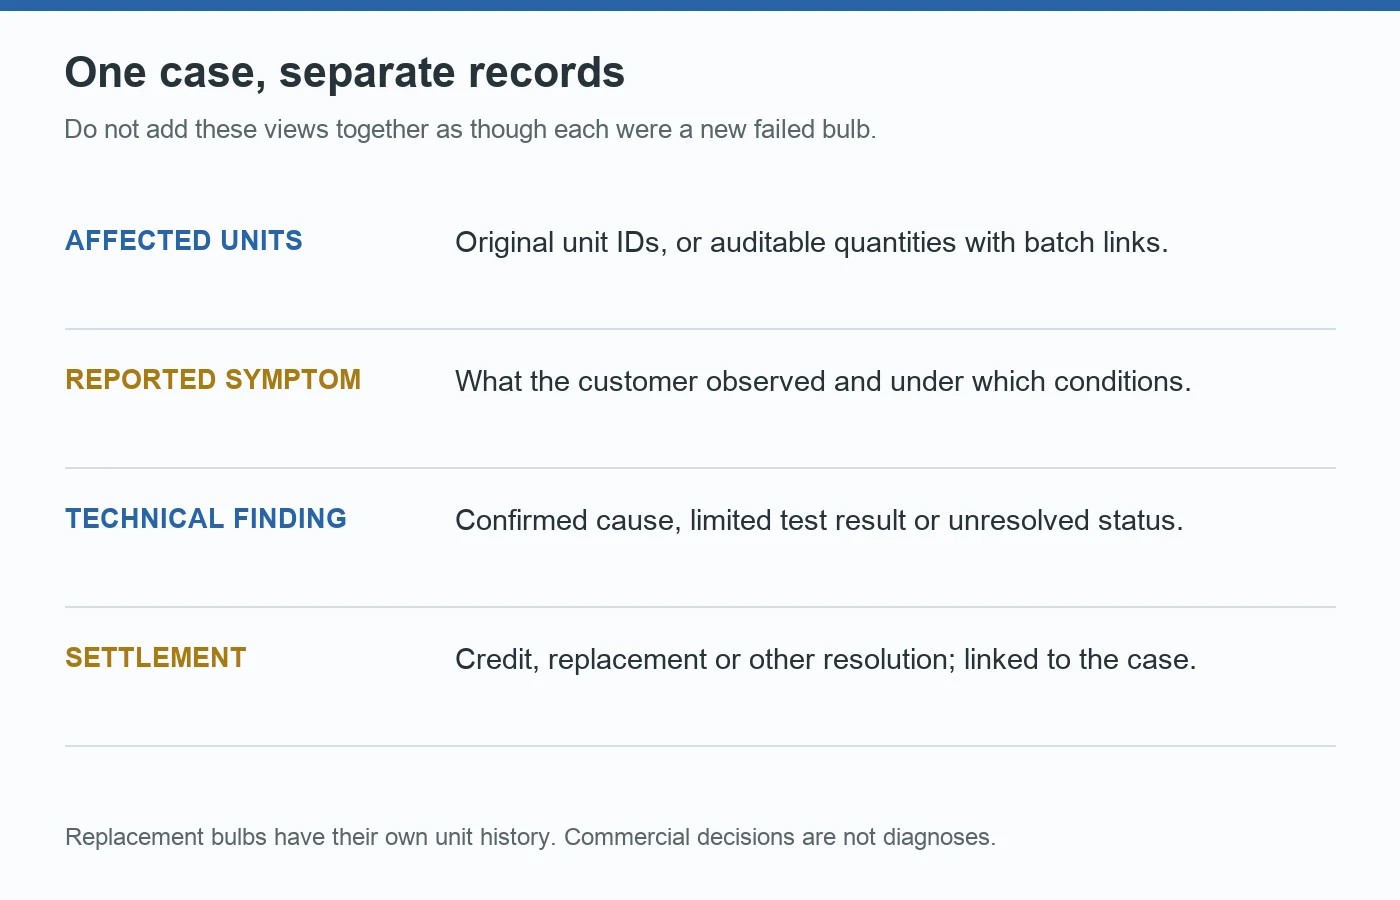
Keep unconfirmed cases visible. Separate "confirmed product nonconformity," "documented installation or compatibility issue," "transport damage" and "unresolved" where evidence supports those classifications. A claim paid as a goodwill gesture does not become a confirmed manufacturing defect, and a rejected warranty claim does not disappear from the complaint record.
Do not energize visibly damaged or suspect lamps for informal warehouse experiments. Preserve evidence and route electrical investigation to competent personnel using suitable procedures.
Buyer judgment 4: Record commercial settlement and technical cause separately. Neither a credit note nor a denied claim establishes the engineering conclusion.
Count Units Once, but Do Not Lose Repeat Problems
One customer email can describe twelve affected bulbs. Three emails can describe the same bulb. A shipment of ten goodwill replacements may resolve a claim involving only two original units. Counting messages, replacement units and failures as if they were interchangeable creates a misleading scorecard.
Use a case identifier and a unit identifier where available. Otherwise retain an auditable quantity and batch link, with uncertainty stated. For a first-return proportion, count an original unit once. Track a replacement bulb as a separate unit linked to the original case; do not silently add it to the original installation cohort or erase its later failure.
Keep the product detail sufficient for investigation. With Edison tubular bulbs, record the exact size and version, not merely "T-series." A combined return total cannot tell a factory which drawing, component revision or batch needs review.
What to Ask Before Your Next Supplier Review
| Review item | Question to settle before comparing |
|---|---|
| Population | Which models, revisions, batches, markets and applications are included? |
| Observation | What age-in-service window applies, and how much follow-up is verified or unknown? |
| Event definition | Are these returned units, complaints or technically confirmed failures? |
| Traceability | Can numerator units be linked to the denominator without duplicates? |
| Mix and uncertainty | Are application weights comparable, counts sufficient and limitations disclosed? |
| Response quality | How quickly are serious issues contained, evidence reviewed and corrective actions verified? |
A practical factory-facing review should end with an affected-population definition and an investigation or corrective-action owner, not merely a revised percentage. Compare the relevant pre-change and post-change cohorts only after allowing comparable observation time. A younger revised batch is not automatically a proven improvement.
Do not wait for a statistically impressive percentage before escalating a credible safety concern. A single serious incident can warrant immediate containment and expert review. Return proportions help prioritize ordinary quality work; they are not permission to ignore severity.
Buyer judgment 5: Use return data to choose the next investigation and improve purchasing controls, not as a stand-alone certificate of supplier quality.
Conclusion
The supplier with the smallest reported return percentage may have better products. It may also have younger installations, more stock still in warehouses, a different application mix or less complete reporting.
Ask for comparable populations, comparable exposure and a clear separation between symptoms, confirmed causes and settlements. A transparent supplier who can explain the numerator and denominator offers more decision value than an unexplained claim of "less than 1% returns."
References
- NIST/SEMATEK. Failure or Hazard Rate. Back
- NIST/SEMATEK. Censoring in Reliability Data. Back
- NIST/SEMATEK. Kaplan-Meier Estimation. Methodological background, not an analysis of actual HongYu field records. Back
- U.S. Department of Energy. LED Basics: Lifetime and Reliability Considerations. Used for the distinction between reliability outcomes, not generic lifetime promises. Back