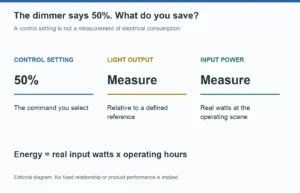
Featured image: Original editorial diagram. Control setting, light output and electrical input are different quantities.
A restaurant sets its decorative lights to 50% for dinner service. The purchasing team halves the lamps' rated wattage in its energy spreadsheet. The calculation looks reasonable, but it assumes something the dimmer has never promised: that its displayed percentage is a power measurement.
Dimming can save electricity. The saving must be calculated from real input watts and operating hours, not from the position of a slider. A credible estimate also names the comparison baseline and states whether it includes the controls.
For importers, lighting brands and hospitality buyers, this distinction changes what to request from a supplier. A compatibility test tells you whether a lamp and dimmer work acceptably together. An energy estimate needs another set of evidence: power at the scenes the venue will actually use, multiplied by the time spent in each scene.
Four Different Meanings of 50 Percent
The same percentage can describe four different things. Do not copy a number from one column into another without evidence.
| Quantity | What it describes | What to use it for |
|---|---|---|
| Control setting | A command, displayed level or position on the dimmer | Identifying a repeatable scene on a specified control |
| Relative measured light | Light at that scene divided by a defined full-output reference | Comparing dimming depth using a stated photometric method |
| Perceived brightness | How bright the lighting appears to an observer | Evaluating the visual experience in the intended space |
| Relative input power | Real watts at that scene divided by real watts at the reference state | Estimating energy over time |
PNNL's 2014 CALiPER study found different relationships between control signal and light output among the LED lamps it tested. It also showed why the lamp and dimmer combination matters. These historical results illustrate the measurement problem; they are not performance data for a current HongYu model.[1]
Perception adds another distinction. Lutron's measured-versus-perceived-light guide illustrates that 10% measured light can correspond to approximately 32% perceived light in its design model.[2] That is a visual-design relationship, not a conversion to electrical watts, and it does not predict every observer's experience in every room.
Buyer judgment 1: Ask what the percentage measures and what defines 100%. "Dims to 10%" and "uses 10% power" are different claims.
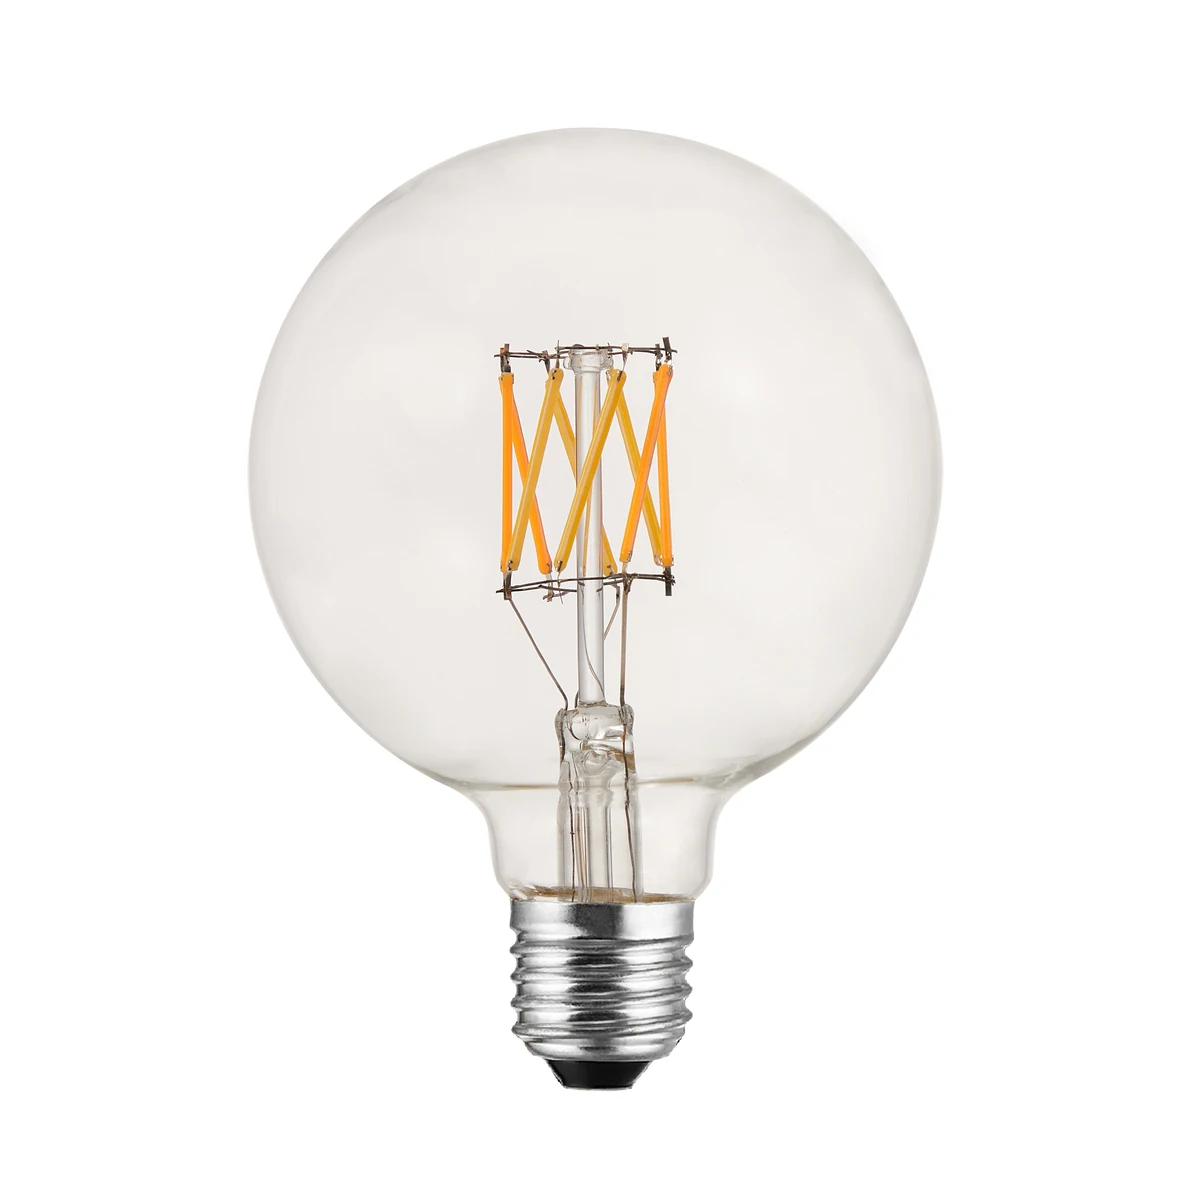
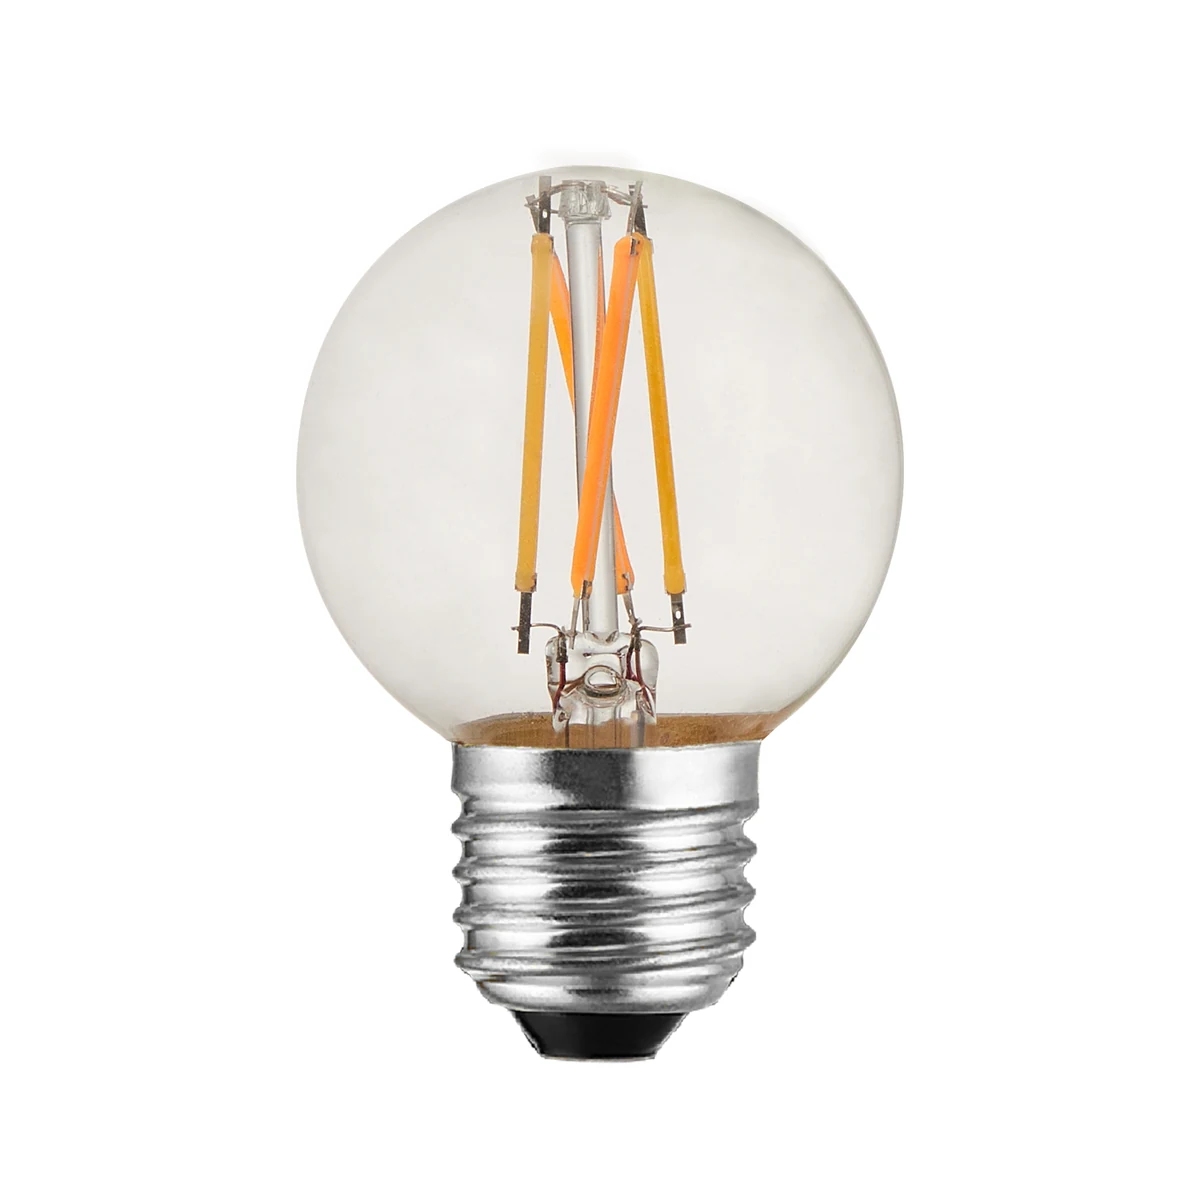
When sourcing a dimmable option from the EU standard filament bulb range, identify the exact lamp, control, supply and connected lamp count. A graph for another wattage or driver revision should not be inserted into the energy model simply because the bulb has the same shape.
Measure the Scenes the Venue Will Use
A restaurant does not operate at one abstract dimming percentage all day. It may use a bright preparation scene, a dinner scene, a late-evening scene and an off state. Build the estimate around that operating sequence.
For each scene, record real input power after the system has settled, together with the actual control setting and the lighting conditions needed to reproduce it. Keep the fixture, lamp count, supply and measurement method consistent. A qualified test provider should select instrumentation suitable for the waveform and low power levels being measured; do not estimate watts from current alone or from a phone light-meter app.
Choose the measurement boundary before collecting numbers. Measurements at the lamps describe lamp consumption. Measurements at the input to the controlled circuit can include the dimmer's consumption. A gateway or controller supplied from another circuit needs separate accounting if it belongs in the project total. Conversely, do not add control losses again when the meter already includes them.
The full-output reference needs care too. PNNL distinguished operation through a switch from operation through a dimmer at maximum setting; the two need not produce identical performance.[1] Specify which state is the baseline rather than quietly combining a catalogue wattage with a different installed configuration.
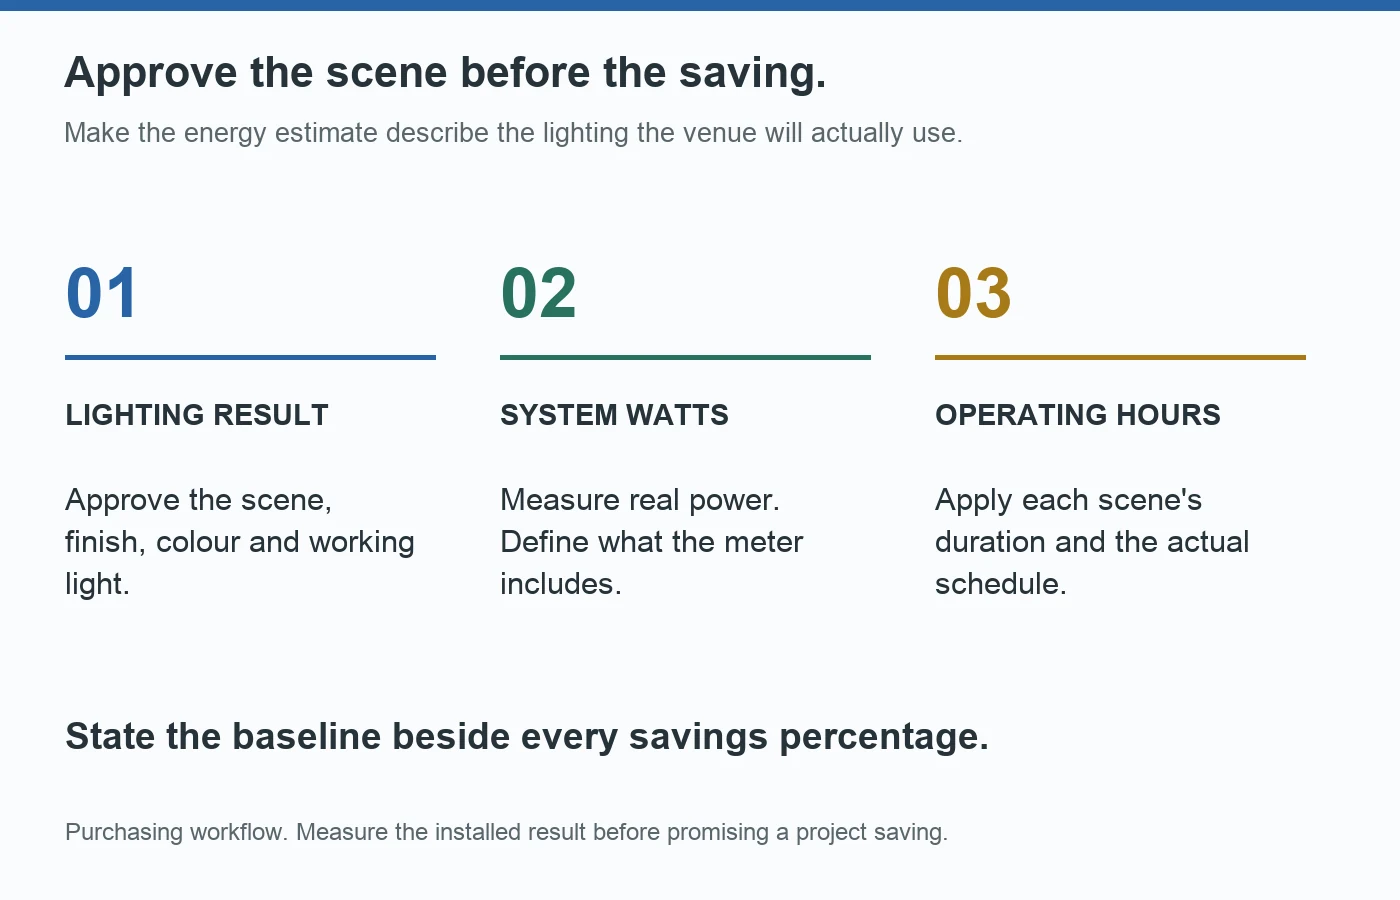
Buyer judgment 2: Request watts at operating scenes, not just watts at full output. An impressive minimum dim level says little about energy use if the venue spends most of its time at a mid-level setting.
A Restaurant Schedule Gives a More Useful Answer
Consider a hypothetical installation with 100 identical lamps. Each lamp uses an assumed 4.0 W at the chosen full-output reference. The following scene powers are invented to demonstrate the calculation, not HongYu test data or a customer case.
| Operating scene | Hours per day | Assumed real power per lamp | Energy for 100 lamps |
|---|---|---|---|
| Preparation and cleaning | 4 | 4.0 W | 1.60 kWh |
| Dinner service at a displayed 50% setting | 6 | 2.6 W | 1.56 kWh |
| Late evening at an approved low scene | 2 | 0.8 W | 0.16 kWh |
| Total illuminated period | 12 | Varies by scene | 3.32 kWh |
For a constant-power scene, the arithmetic is:
Scene energy in kWh = lamp count x measured watts per lamp x hours / 1,000.
Add the scene energies to obtain the daily total. The Australian Government's running-cost guidance uses the same basic relationship between input power, operating time and electricity price.[3]
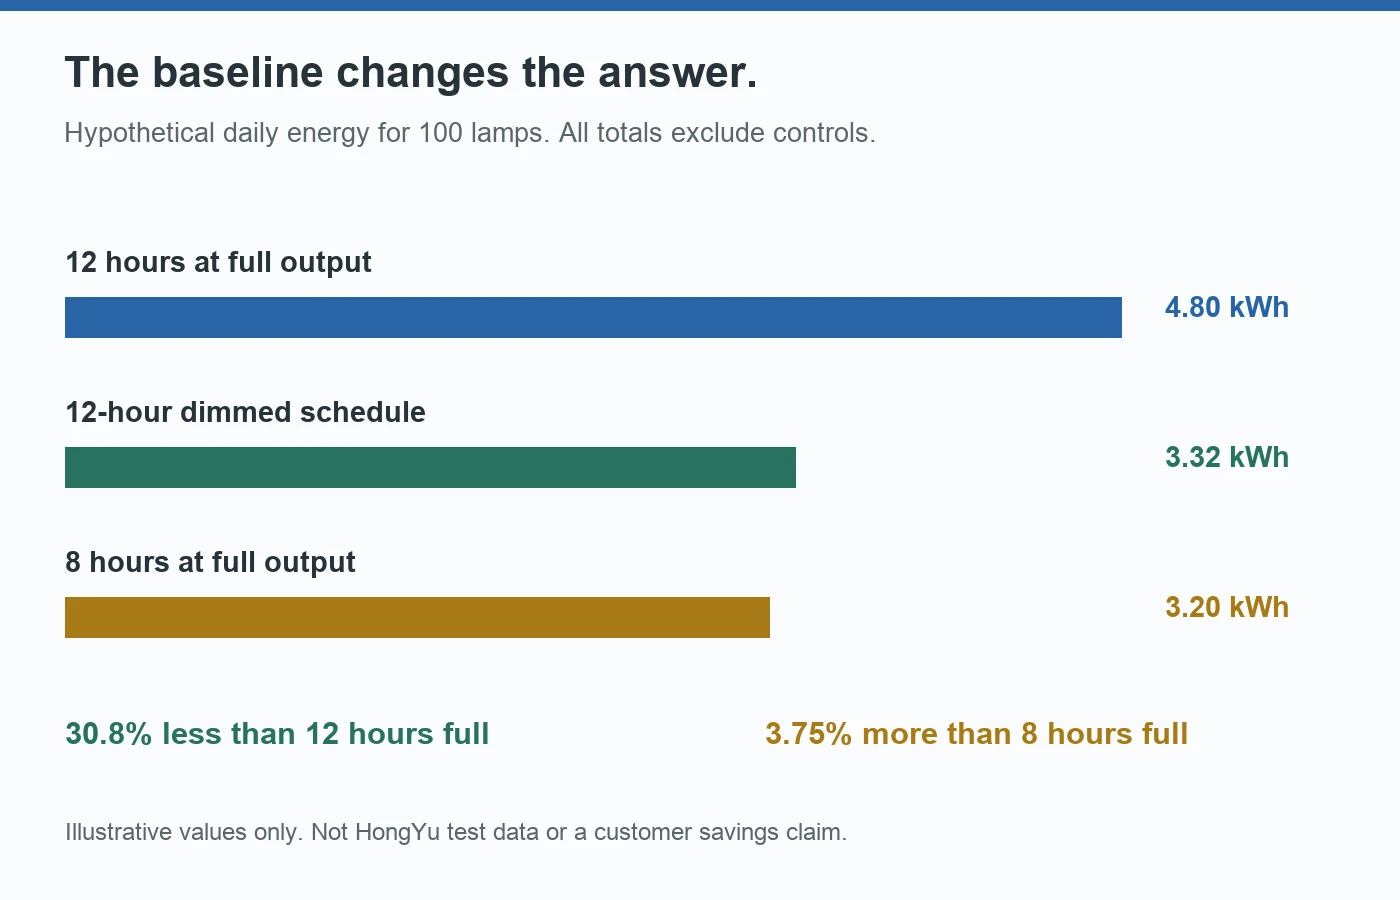
Running these same lamps at 4.0 W for all 12 hours would use 4.80 kWh. The hypothetical dimmed schedule therefore saves 1.48 kWh per day, or approximately 30.8% of lamp energy, against that specific baseline. At 330 operating days, the difference is 488.4 kWh per year.
During dinner service alone, the assumed reduction is 35%: (4.0 - 2.6) / 4.0. It is not 50%, even though the displayed setting says 50%. The daily reduction differs again because some hours remain at full output and others use a lower scene.
This calculation excludes control consumption in both cases. For a complete project estimate, measure or add the applicable controls and off-state consumption consistently on both sides. Do not multiply a shared controller's watts by the number of lamps.
Buyer judgment 3: Require the baseline next to every savings percentage. "30.8% less lamp energy than 12 hours at full output" is useful; "30.8% more efficient" is not an equivalent statement.
Longer Operating Hours Can Reverse the Result
Now change only the comparison question. Suppose the venue previously ran those lamps at full output for eight hours, rather than twelve. Its previous lamp energy would be 3.20 kWh per day.
The new twelve-hour dimmed schedule uses 3.32 kWh, which is 3.75% more, not less. Dimming still reduces consumption during the hours when it lowers input power. The installation nevertheless uses more daily energy because it now runs longer.
That additional service may be valuable: the venue could be open longer or using decorative lighting at times when it was previously off. The mistake is not providing it. The mistake is promising an energy reduction while hiding the extra hours.
Separate two comparisons in a project proposal. To isolate the effect of dimming, hold the operating hours and hardware constant. To predict the change in actual consumption, compare the old and proposed schedules as they will really operate. Both calculations can be valid, but they answer different questions.
Do not add unrelated savings percentages either. A lamp replacement claim and a dimming claim often use different baselines. Calculate the final system's kWh directly rather than adding the two advertised percentages.
Preserve the Lighting Result Before Comparing Watts
Lower energy use is not automatically a successful lighting specification. The selected scene still has to serve the room: staff need appropriate working light, guests need a comfortable view of faces and tables, and the decorative bulbs must produce the intended appearance.
Set the required lighting result first. Check illuminance at relevant locations using a repeatable arrangement, then assess the scene visually. Lux at a particular table is not the same quantity as total lamp lumens, so name the measurement and keep positions consistent. Comparing two lamps at the same slider setting is not a fair energy comparison if they deliver substantially different lighting results.
For an exposed fitting, the EU porcelain filament bulb range introduces a finish choice that belongs in the visual approval, not merely in the wattage column. Approve the actual finish, fixture and scene together before deciding whether a lower-power alternative meets the brief.
Dim-to-warm adds a further reason to test the intended scene. DOE describes this category as linking reduced output with a warmer colour appearance.[4] The desired colour may therefore occur at a particular operating point, rather than at whatever level produces the lowest meter reading.
When comparing EU dim-to-warm bulbs, request light output, colour temperature and input power at the scenes that matter to the project. Do not infer their relationship from the two endpoint CCT values alone. Check starting, stability and audible noise at those scenes as separate acceptance items.
Buyer judgment 4: Compare energy after approving the scene, not before. A lower watt reading is not a saving at equivalent service if the replacement no longer delivers the required light or colour experience.
Turn the Sample Test into a Purchasing Record
The useful supplier deliverable is a small scene-performance record, not a promise that every dimmer percentage produces the same percentage saving. Ask for:
- Product identity: model, finish, nominal voltage, dimming option and relevant revision.
- Control configuration: exact dimmer model, connected lamp count, trims and programmed scene values.
- Test conditions: supply, fixture or holder, orientation, ambient conditions and stabilization method.
- Scene results: real watts, defined light measurement, colour where relevant, and observed operating behaviour.
- Commercial assumptions: hours in each scene, operating days, measurement boundary and energy-price basis.
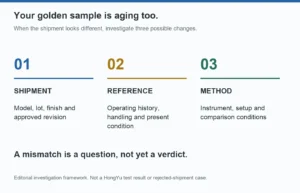
For production approval, agree which sample results establish the reference and what variation is acceptable. Do not imply that one prototype's wattage is a guaranteed maximum for every lamp in every installation. Where the projected saving is commercially critical, arrange a representative installed check before committing to the full rollout.
Also define who owns the settings after installation. Low-end trims, scene programming and staff overrides can change the conditions on which the estimate depends. DOE's lighting-controls work identifies configuration and real-world operation as important barriers to achieving the benefits of controls.[5]
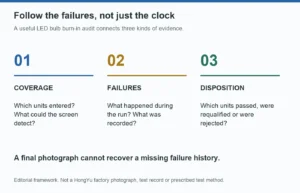
At handover, retain the approved scene settings and schedule. After representative operation, compare metered consumption with the estimate and investigate differences in hours, settings, lamp count or measurement boundary. There is little value in a precise laboratory curve if the site never uses the assumed scenes.
Buyer judgment 5: Treat the operating schedule as part of the energy specification. A bulb supplier can support product measurements; the venue must also confirm how the installed system will be used.
Conclusion
A dimmer percentage is a control instruction, not an electricity bill. The defensible saving comes from measured real power, time in each operating state and an explicitly defined baseline.
For decorative LED projects, start with the approved lighting scene, measure the lamp-and-control configuration that produces it, and calculate the actual schedule. Keep lamp-only consumption distinct from complete-system consumption. Then the energy claim can survive a check against the meter, not just a glance at the slider.
References
- Pacific Northwest National Laboratory, Retail Lamps Study 3.1: Dimming, Flicker, and Power Quality Characteristics of LED A Lamps, December 2014. Historical study of lamp-and-dimmer behaviour and measurement conditions. Back to text.
- Lutron, Measured Light vs. Perceived Light. Visual-design model distinguishing measured and perceived levels. Back to text.
- Australian Government, Energy Ratings: Estimate Running Costs. Input power, operating time and electricity-price calculations. Back to text.
- U.S. Department of Energy, Understanding LED Color-Tunable Products. Dim-to-warm operation and colour-control considerations. Back to text.
- U.S. Department of Energy, Lighting Controls Solutions. Configuration and operation in real installations. Back to text.